
Professional traders do not rely only on memory, confidence, or gut feeling.
They use data.
Not because data makes trading easy. It does not. Markets are still uncertain, losses still happen, and no journal can remove risk. But data gives serious traders something most beginners do not have: a clear feedback loop.
Instead of asking, “Why do I keep losing?” professional traders ask better questions:
- Which setups are actually profitable?
- Where does my execution break down?
- Are my losses planned or caused by broken rules?
- Which market conditions fit my strategy?
- Do emotions change my position size, entries, or exits?
At TradeDoctorAI, we believe trade analysis should go beyond basic profit and loss. A good trading journal should help you understand the quality of your decisions, not just the result of your trades.
Professional trade analysis is not about proving you were right. It is about finding what is repeatable.
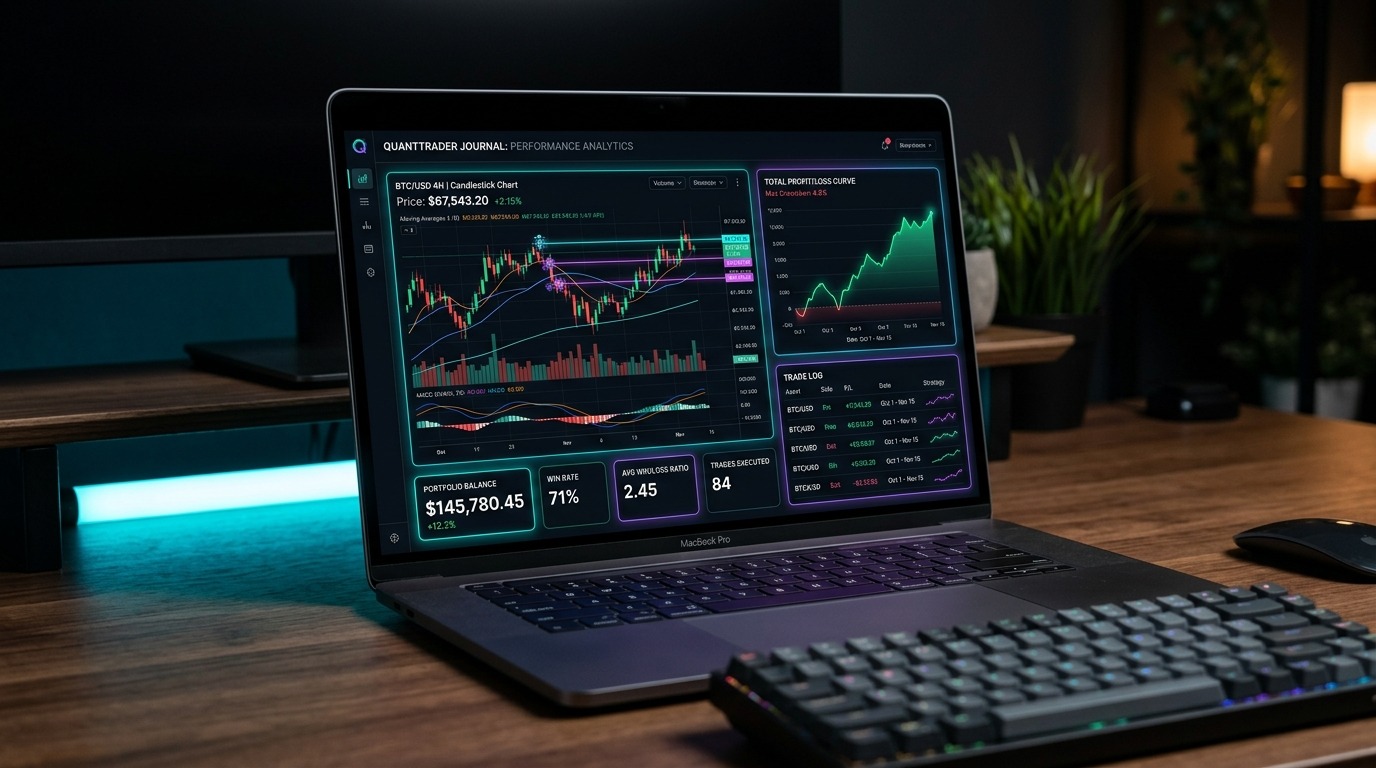
What Data-Driven Trade Analysis Really Means
Data-driven trade analysis means reviewing your trades using measurable information instead of vague impressions.
A beginner might say:
“I had a bad week. I need better discipline.”
A professional-style review sounds more like:
“I took 18 trades this week. My planned pullback setups were +4.2R, but my late breakout entries were -2.6R. Three of my four worst trades happened after a prior loss, and two exceeded planned risk.”
That second review is useful because it shows exactly what needs attention.
Professional traders analyze trades using data points such as:
- R-multiple
- Win rate
- Average winner and average loser
- Setup type
- Market condition
- Entry quality
- Exit quality
- Planned risk versus actual risk
- Rule adherence
- Emotional state
- Time of day
Step 1: Measure Results in R-Multiple
Professional traders often review performance in R-multiple because it normalizes trade results.
R means risk. If you planned to risk $100 on a trade, then $100 equals 1R.
- A $100 loss equals -1R.
- A $200 gain equals +2R.
- A $50 gain equals +0.5R.
This matters because dollars alone can be misleading. A $500 win may look great, but if you risked $1,000 to make it, the trade was only +0.5R. A $100 loss may look small, but if your planned risk was $40, the trade was actually -2.5R.
Using R-multiple helps traders compare trades fairly across different position sizes, symbols, and account balances.
Step 2: Separate Setup Types
Professional traders do not analyze every trade as one big group.
They separate trades by setup type because each strategy has different behavior.
Common setup categories include:
- Breakout trades
- Pullback continuation trades
- Reversal trades
- Opening range breakout trades
- Range trades
- Liquidity sweep trades
- Scalp trades
This helps answer one of the most important questions in trading: where is my edge?
| Setup Type | Trades | Result | Observation |
|---|---|---|---|
| Pullback continuation | 26 | +8.4R | Best in clean trending conditions |
| Breakout | 21 | -3.1R | Many entries were late or chased |
| Reversal | 14 | -1.8R | Rules need more definition |
This kind of breakdown helps traders stop guessing. If one setup is clearly stronger, it may deserve more focus. If another setup keeps losing, it may need better rules or removal from the plan.
Step 3: Track Market Conditions
A setup does not work equally well in every market.
Professional traders review performance by market condition because context matters. A breakout strategy may work well in high-volume trending markets but fail repeatedly in choppy ranges. A mean reversion strategy may perform well in ranges but struggle during strong momentum.
Useful market condition tags include:
- Trending
- Ranging
- Choppy
- High volatility
- Low volume
- News-driven
- Clean structure
- Messy structure
Inside your TradeDoctorAI trading journal, tagging market conditions helps you see whether your strategy has a real environment where it performs best.
Step 4: Analyze Entry Quality
The entry is not just a price. It is a decision.
Professional traders review whether the entry followed the plan based on the information available at the time. They avoid judging only with hindsight.
Entry quality can be tagged simply:
- Planned: Entry matched the strategy rules.
- Early: Entry happened before confirmation.
- Late: Entry happened after the best risk-reward was gone.
- Chased: Entry was driven by urgency or fear of missing out.
This helps reveal patterns. If late entries are consistently losing, the trader may need a rule around maximum distance from invalidation. If early entries are losing, the trader may need stronger confirmation rules.
Step 5: Review Exit Quality
Many traders focus on entries but lose their edge through poor exits.
Professional trade analysis looks at why the trade was closed.
Common exit tags include:
- Target hit
- Stop loss hit
- Trailing stop hit
- Manual exit based on structure
- Early exit from fear
- Late exit from greed
- Exit after rule break
This is important because a trader may have a profitable strategy but close winners too early. Over time, early exits can reduce average winner size and weaken the entire system.
Step 6: Compare Planned Risk vs. Actual Risk
This is where many serious trade reviews become uncomfortable.
Professional traders compare what they planned to risk with what actually happened.
Ask:
- What was the planned risk before entry?
- Was the stop loss placed at a valid invalidation level?
- Did the trade stay within planned risk?
- Did I move the stop farther away?
- Did I add to the position emotionally?
- Was the final loss larger than expected?
If a trade was planned as -1R but ended as -2.3R, the issue is not only that the trade lost. The issue is that risk expanded after the decision was already made.
A tool like AI Trade Review can help identify whether these risk management mistakes repeat across multiple trades.
Step 7: Measure Rule Adherence
Professional traders know that strategy data is unreliable if the strategy was not actually followed.
If you say you are testing a breakout strategy but half your trades are early entries, revenge trades, or random scalps, your results do not truly represent the strategy.
That is why rule adherence matters.
Track each trade as:
- Followed plan
- Minor rule break
- Major rule break
Then review performance by category.
| Rule Adherence | Trades | Result | Lesson |
|---|---|---|---|
| Followed plan | 32 | +9.6R | Strategy performs when executed properly |
| Minor rule break | 12 | -1.2R | Small issues reduce edge |
| Major rule break | 7 | -6.8R | Most damage comes from discipline breakdown |
This kind of review can be eye-opening. Many traders discover that their “strategy problem” is actually a rule-following problem.
Step 8: Track Emotional State
Professional traders do not pretend emotions do not exist. They track how emotions affect decisions.
Simple emotional tags can include:
- Calm
- Patient
- Rushed
- Fearful
- Frustrated
- Bored
- Overconfident
- Revenge-minded
- FOMO
Then compare emotional state with trade quality and results.
You may find:
- Calm trades have better execution scores.
- Frustrated trades lead to larger losses.
- Bored trades happen in low-volume conditions.
- FOMO trades are usually late entries.
- Overconfident trades use larger position size.
This turns trading psychology into measurable feedback instead of vague self-criticism.
Step 9: Analyze Time of Day
Time matters more than many traders expect.
Professional traders often review performance by session or time window because decision quality and market behavior change throughout the day.
For example:
- A stock trader may perform best during the first 90 minutes.
- A forex trader may perform better during London than late New York.
- A futures trader may lose money during lunchtime chop.
- A crypto trader may trade worse late at night due to fatigue.
If your journal shows that your worst trades happen after your focus drops, the fix may be a shorter trading window, not a new strategy.
Step 10: Review Best Trades and Worst Trades
Professional traders study both sides.
Your best trades show what to repeat. Your worst trades show what to protect against.
For Best Trades, Ask:
- What setup was this?
- What market condition supported it?
- What did I do well?
- Was my risk controlled?
- Was this trade repeatable?
For Worst Trades, Ask:
- Was the setup valid?
- Which rule did I break?
- Was emotion involved?
- Did actual risk exceed planned risk?
- What rule would have stopped this trade?
You can read more performance review guides on the TradeDoctorAI blog.
Step 11: Use AI to Find Patterns Faster
Manual review is useful, but it can become difficult when you have many trades, notes, screenshots, and emotional tags.
TradeDoctorAI helps traders analyze trade data more efficiently by identifying repeated patterns across journal entries.
AI trade analysis can help surface insights such as:
- Your strongest setup is pullback continuation in trending conditions.
- Your biggest losses usually happen after moved stops.
- Your execution quality drops after the first loss of the day.
- Your breakout trades underperform when volume is weak.
- Your notes before poor trades often include urgency or frustration.
This does not replace your judgment. It gives you a clearer starting point for review.
Step 12: Turn Data Into Rules
Data only helps if it changes behavior.
After reviewing your trades, create one clear rule for the next week.
Weak Review Conclusion
“I need to be more disciplined.”
Better Data-Based Rule
“No trades within 10 minutes after a losing trade because my post-loss trades are negative over the last 30 entries.”
Or:
“Only take breakout trades when volume confirms, because low-volume breakout trades are my weakest setup category.”
This is how professional traders use data: they convert patterns into specific rules.
Featured Answer: How Do Professional Traders Analyze Trades?
Professional traders analyze trades by reviewing R-multiple, setup type, market condition, entry quality, exit quality, planned risk versus actual risk, rule adherence, emotional state, time of day, and best and worst trades.
The goal is to identify repeatable strengths, repeated mistakes, and specific rules that improve future decision-making.
FAQ
What data should traders track?
Traders should track date, symbol, direction, entry, exit, stop loss, target, position size, result in R, setup type, market condition, entry quality, exit quality, planned risk, actual risk, rule adherence, emotion, and screenshots.
Why do professional traders use R-multiple?
Professional traders use R-multiple because it measures results relative to planned risk. This makes it easier to compare trades fairly across different position sizes and markets.
How often should traders analyze their data?
Traders should review individual trades after each session, then do a deeper weekly review. Monthly reviews are useful for setup performance, strategy refinement, and bigger pattern recognition.
Can AI help analyze trading data?
Yes. AI can help analyze trading data by summarizing journal notes, identifying repeated mistakes, comparing setups, detecting emotional patterns, and showing where risk management breaks down.
Is profit and loss enough to judge trading performance?
No. Profit and loss is important, but it does not tell the full story. Traders also need to review execution quality, rule adherence, risk management, market condition, and whether the trade was repeatable.
Final Thoughts: Data Shows What Memory Misses
Professional traders do not analyze trades to feel good or bad about the week. They analyze trades to make better decisions next week.
They know that memory is biased. A painful loss can feel more important than it really was. A lucky win can hide poor discipline. A bad day can look random until the data reveals the pattern.
TradeDoctorAI helps traders turn journal entries into clearer trade analysis. Use it to review R-multiple, setups, risk, emotions, rule adherence, and repeated mistakes so your trading decisions become easier to understand and improve.
The more clearly you analyze your trades, the less you have to guess about what is working.