
A journal is not a backtest, but it can do something a backtest cannot: tell you how you actually traded a strategy, with your hesitations, early exits and skipped signals included. The two answer different questions, and mixing them up is a common way to talk yourself into a strategy that only works on paper.
Backtest versus journal review
| Backtest | Journal review | |
|---|---|---|
| Question answered | Does the rule have an edge in history? | Does my execution of the rule have an edge? |
| Main risk | Overfitting to the past | Small samples and selective memory |
| Costs and slippage | Usually estimated | Real |
| Behavior | Perfect | Human |
The sensible order: backtest to see if the idea is worth trading, trade it small, then use the journal to learn whether you can execute it. Comparing the two is where the insight is. If the backtest says +0.4R per trade and your journal says +0.1R, the difference is your execution, and now you know where to look.
Step 1: Tag every trade with exactly one setup
This is the foundation. If a trade is "pullback, but kind of a breakout", pick one and note the ambiguity. Aim for five or fewer setup tags. TradeDoctor AI’s free plan allows three strategies, which is a decent constraint when you are starting out.
Step 2: Wait for a sample
Here is a 40-trade journal split by setup, with average R per trade:
| Setup | Trades | Average R | Total R |
|---|---|---|---|
| Pullback to support | 18 | +0.45 | +8.1 |
| Range breakout | 14 | −0.10 | −1.4 |
| News fade | 8 | +0.60 | +4.8 |
| All | 40 | +0.29 | +11.5 |
Tempting conclusion: drop breakouts, trade pullbacks and news fades. Slow down. With a typical R standard deviation of about 1.2, the uncertainty on a 40-trade average is about ±0.19R. The overall +0.29R is only about 1.5 standard errors from zero. And the news fade row, +0.60R on 8 trades, has an uncertainty around ±0.42R. That figure could be real or luck.
The workable rule: do not remove a setup on fewer than 30 trades, but you can reduce size on a setup that looks weak while the sample grows.
Step 3: Slice by conditions, carefully
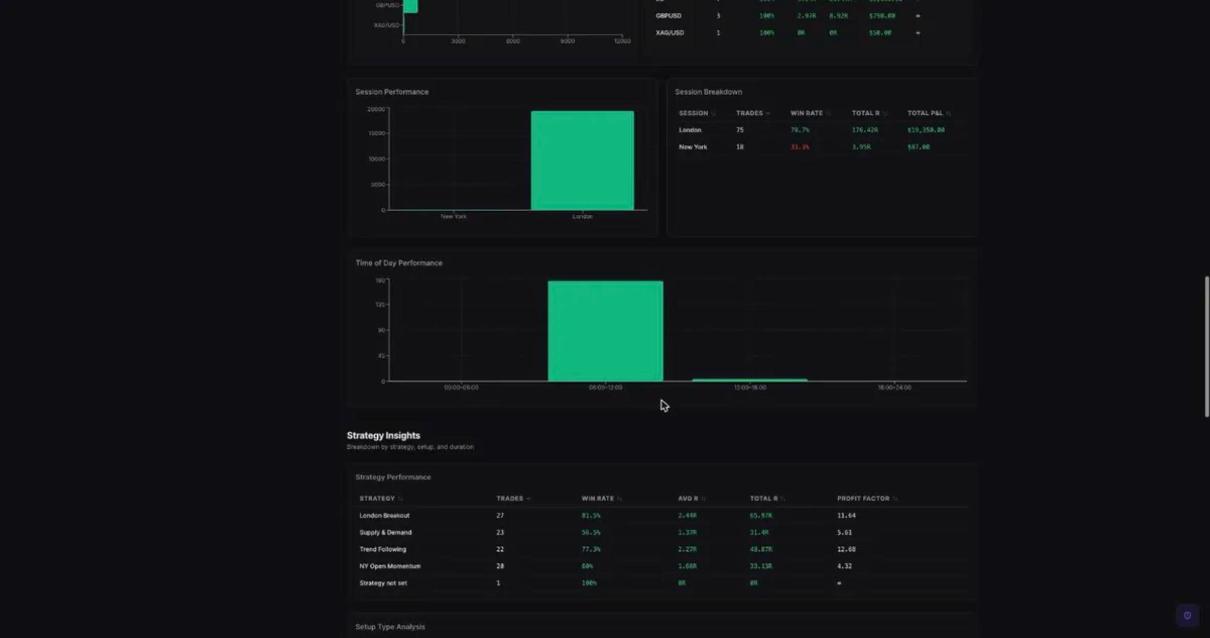
Once a setup has enough trades, split it once, by something you can act on: session, instrument, day of week, or your sleep/focus rating. Each additional split shrinks the sample and raises the odds of finding a pattern that is not there. Write down the split you are going to test before you look at the answer.
Step 4: Compare plan versus actual
For each trade, ask whether you followed your entry and exit rules. Separate the results into followed-plan trades and broke-plan trades. If followed-plan trades average +0.5R and broke-plan trades average −0.4R, your strategy is fine and your discipline is the problem. That is the most common finding when traders do this honestly, and it is a cheap one to fix compared with a new strategy.
Step 5: Change one thing and restart the count
When you adjust a rule, start a new sample under a new tag or note. Mixing pre- and post-change trades makes your statistics meaningless. Use a version number in the strategy name if needed: "Pullback v2".
What TradeDoctor AI does here
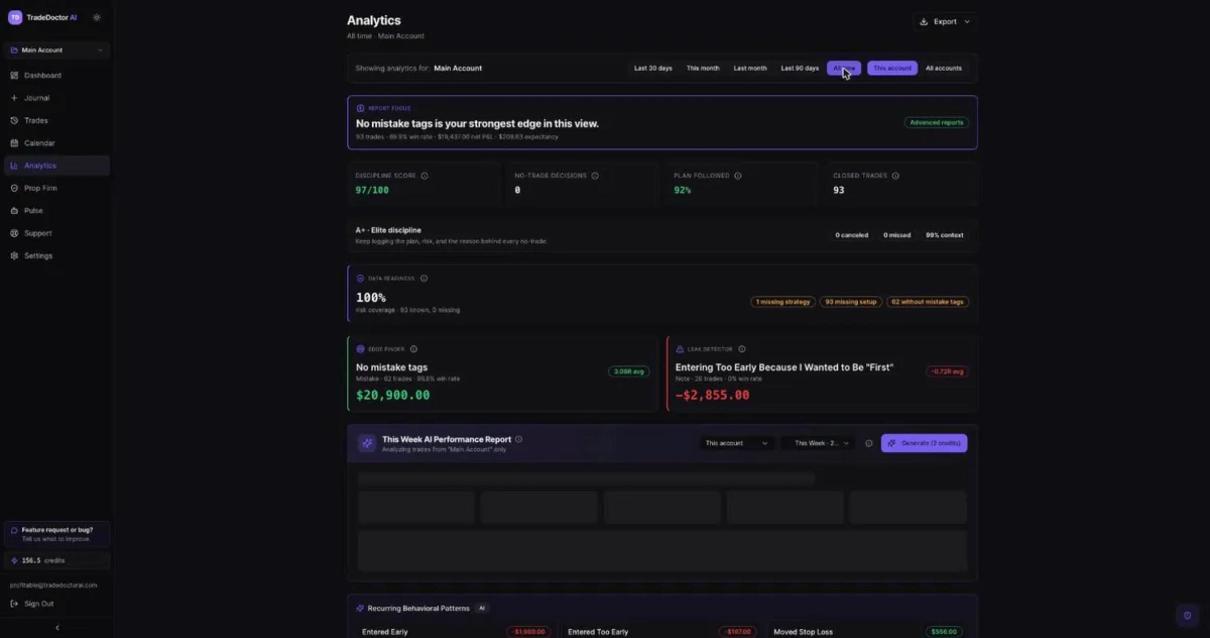
You can import your trade history or log trades, tag strategies and mistakes, and read expectancy, win rate and profit factor per strategy. You can also ask the AI Coach questions like "which of my strategies has the highest expectancy?" and it answers from your logged data. It is not a historical simulation engine. It will not test a rule on years of price data, so for the backtest half you still need charting software or a script.
Related: how to use your journal to find your edge, expectancy explained.
A worked example: slicing 60 trades by setup and session
Suppose you have logged 60 trades across two setups, a breakout (35 trades) and a pullback (25 trades). Overall your average is +0.12R, which looks like a thin edge. Split it up and the breakout averages -0.08R while the pullback averages +0.41R. The overall figure was the blend of one setup that works and one that does not.
Now slice the pullback by session: 15 trades in London average +0.60R, and 10 in New York average +0.14R. Those are small numbers, so the right move is not to stop trading New York but to keep logging and check again at 30 trades per bucket. The right move for the breakout is more decisive, since 35 trades at a negative average is a sample worth taking seriously: reduce size or pause it while you review the entries.
Journal data and its blind spots
A journal only contains trades you took. It cannot tell you about setups you skipped, setups you did not notice, or what would have happened if you had used a different stop. That is the main difference from a proper backtest, which scans all the history under fixed rules.
Journal data also reflects your own execution. If you take a setup only when you feel confident, the journal measures “setup plus your confidence filter”, not the setup in its pure form. That is useful if you will keep using the filter, and misleading if you will not.
Finally, market conditions change. A year of trades in a trending market may say little about a ranging one. Record the market condition as a tag so you can look at it separately.
Using both: backtest first, journal second
The two methods are complements. A backtest or chart study suggests that a setup has some edge in history. The journal tells you whether you can actually execute it, and at what cost in slippage, hesitation and rule breaks. If the backtest shows +0.3R and your journal shows +0.05R for the same setup, the gap is your execution, and that gap is exactly what a weekly review is for.
TradeDoctor AI is a journal, not a backtesting tool. It does not replay historical price data or test rules on past charts. What it gives you is the live-trade side: the trade history, the strategy and session breakdowns, and the plan-versus-actual picture. If you want a rigorous backtest, use a charting platform or a spreadsheet, then bring the setup definition into your journal.
A minimum viable process
- Write the setup definition in two or three sentences so another trader could identify it.
- Tag every trade with that setup name and nothing else.
- Log at least 30 trades before judging.
- Review the average R, win rate and the worst five trades.
- Change one thing, and start the count again from zero for the changed version.
Related reading: trading expectancy explained and how to use a trading journal to find your edge.
Frequently Asked Questions
Can I backtest using only my trading journal?
You can review past performance, which is a form of forward test of your own execution. It will not tell you how the strategy would have done in conditions you have not traded.
How many trades do I need?
Thirty per setup is a minimum for a rough read. A hundred is better. Fewer than that, treat results as hints.
What if my journal and backtest disagree?
Check costs, slippage and whether you took every signal. Most gaps come from missed signals and early exits.
Should I include losing streaks in the review?
Always. Cutting them out is how traders end up with a strategy that only works in a spreadsheet.