
Most traders track profit and loss.
That is a start, but it is not enough.
Your P&L tells you what happened to your account. It does not always explain why it happened, whether the result is repeatable, or whether your strategy is actually improving. A profitable week can hide poor discipline. A losing week can still include strong execution. One big winner can make weak trading look better than it really is.
That is why serious traders track performance metrics.
At TradeDoctorAI, we believe traders should use data to review both results and behavior. The goal is not to drown yourself in numbers. The goal is to track the few metrics that actually help you make better decisions.
The right trading metrics do not just tell you if you made money. They show whether your process is working.
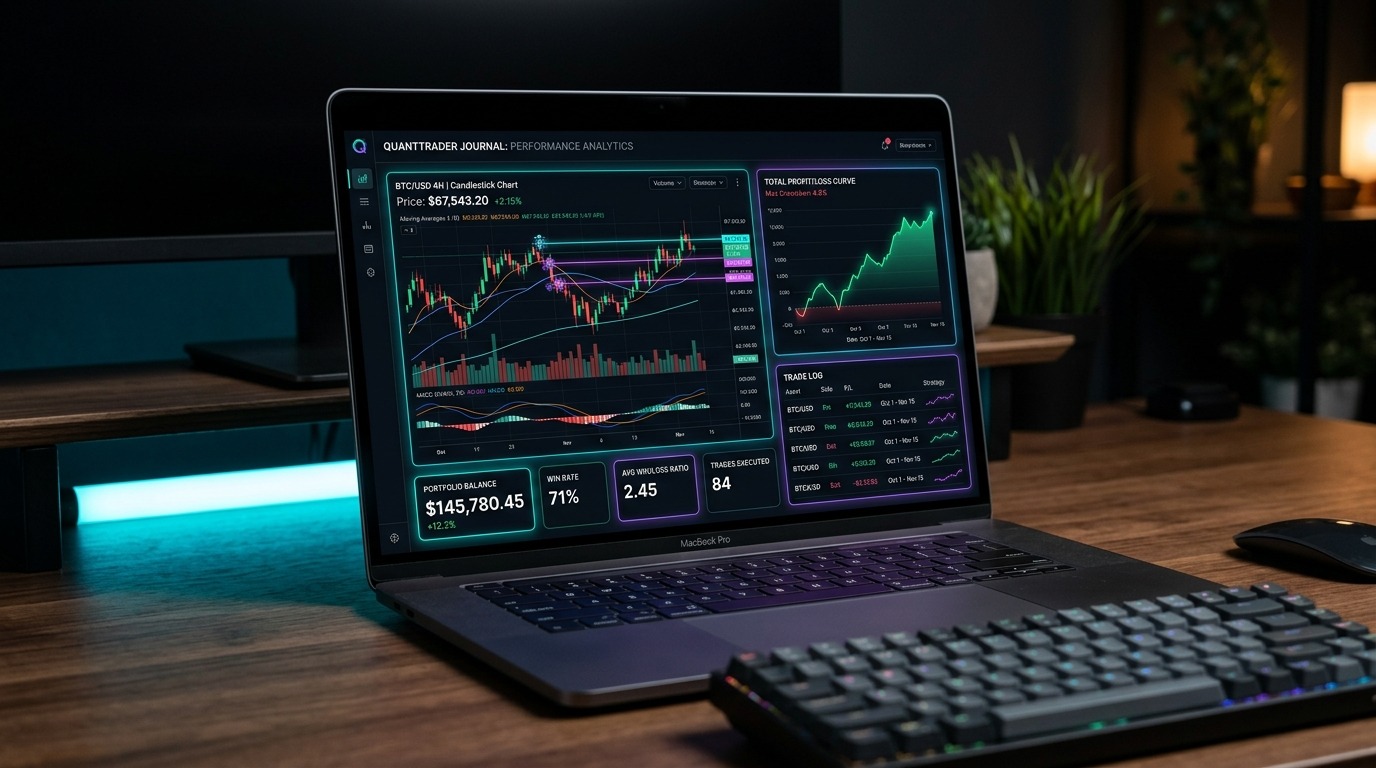
Why Trading Performance Metrics Matter
Trading is a feedback game. If your feedback is unclear, your improvement will be unclear too.
A trader who only tracks P&L may say:
“I lost money this week. My strategy must be bad.”
But a trader who tracks the right metrics may discover:
- The strategy performed well when rules were followed.
- The biggest losses came from two emotional trades.
- Average winners were too small because exits were early.
- Drawdown increased when trade count doubled.
- Rule adherence dropped after the first loss of the day.
That is useful. It gives you something specific to fix.
1. Net Profit or Loss
Net profit or loss is the total amount made or lost after all trades, fees, commissions, spreads, and other costs.
This is the most basic trading performance metric, but it should not be the only one.
Why It Matters
Net P&L shows whether your account grew or declined over a period. It is useful for tracking weekly, monthly, and quarterly performance.
What to Watch
Do not let one big trade distort your view. A positive month may still include poor process if one lucky winner covered many weak trades.
Inside your TradeDoctorAI trading journal, review net P&L alongside setup quality, risk, and rule adherence.
2. R-Multiple
R-multiple measures trade results based on planned risk.
If your planned risk is $100, then:
- A $100 loss is -1R.
- A $200 profit is +2R.
- A $50 profit is +0.5R.
Why It Matters
R-multiple makes it easier to compare trades across different position sizes and markets. It shows whether your trades are performing relative to the risk you planned.
What to Watch
If you plan -1R losses but often record -1.8R or -2.5R losses, your issue may be stop movement, poor sizing, slippage, or emotional risk expansion.
3. Win Rate
Win rate is the percentage of trades that close profitably.
The formula is:
Win rate = winning trades / total trades x 100
Why It Matters
Win rate helps you understand how often your strategy produces winning trades. It also affects the psychology of trading. A lower win rate strategy may still be profitable, but it requires the trader to tolerate more losses.
What to Watch
A high win rate does not guarantee profitability. If your average loser is much larger than your average winner, you can win often and still lose money.
4. Average Winner
Average winner is the average profit from your winning trades.
Why It Matters
This metric shows whether your winning trades are large enough to support your strategy. If your winners are too small, your losses may overwhelm them.
What to Watch
If your planned targets are +2R but your average winner is only +0.6R, you may be exiting too early. That could be a trading psychology issue, not a strategy issue.
5. Average Loser
Average loser is the average loss from your losing trades.
Why It Matters
This metric shows whether your losses are controlled. Good traders do not avoid losses completely. They keep losses within the plan.
What to Watch
If average losers are much larger than planned, review stop placement, position sizing, emotional trades, and whether you are moving stops after entry.
TradeDoctorAI’s AI Trade Review can help identify whether your largest losses share the same behavior pattern.
6. Risk-Reward Ratio
Risk-reward ratio compares the amount you risk with the amount you aim to make.
Examples:
- Risk $100 to make $100 = 1:1
- Risk $100 to make $200 = 1:2
- Risk $100 to make $300 = 1:3
Why It Matters
Risk-reward helps you understand whether the potential reward justifies the risk. It should be reviewed with win rate, not separately.
What to Watch
Do not force high risk-reward ratios with unrealistic targets or stops that are too tight. Track planned risk-reward and actual risk-reward separately.
7. Expectancy
Expectancy is the average amount you can expect to make or lose per trade over a large sample.
A simple formula is:
Expectancy = (win rate x average win) – (loss rate x average loss)
Why It Matters
Expectancy combines win rate and average win/loss into one useful metric. It helps answer the question: “Does this strategy have a positive edge over time?”
Simple Example
- Win rate: 45%
- Average win: +2R
- Loss rate: 55%
- Average loss: -1R
(0.45 x 2R) – (0.55 x 1R) = 0.90R – 0.55R = +0.35R expectancy
Before costs, this strategy averages +0.35R per trade.
8. Maximum Drawdown
Maximum drawdown is the largest decline from account peak to account trough over a period.
For example, if your account grows to $10,000 and then falls to $8,500 before recovering, the drawdown is 15%.
Why It Matters
Drawdown shows how much pressure your strategy puts on your account and your psychology. A strategy may be profitable long term but still difficult to trade if drawdowns are too deep.
What to Watch
Review whether drawdown came from normal losing streaks or from broken rules. A normal strategy drawdown and an emotional account spiral are not the same problem.
9. Rule Adherence Rate
Rule adherence rate measures how often you followed your trading plan.
Example:
- Total trades: 40
- Trades that followed rules: 30
- Rule adherence rate: 75%
Why It Matters
This is one of the most underrated trading metrics. If you are not following your rules, your performance data may not represent your actual strategy.
What to Watch
Break trades into categories:
- Followed plan
- Minor rule break
- Major rule break
Then compare results. Many traders discover that most account damage comes from a small number of major rule breaks.
10. Trade Quality Score
Trade quality score measures the quality of your decision-making, regardless of outcome.
You can use a simple 1 to 5 scale:
- 5: Excellent setup, followed plan completely
- 4: Good trade with minor issue
- 3: Mixed trade
- 2: Weak setup or important rule break
- 1: Emotional trade with poor process
Why It Matters
Trade quality helps separate good trades from winning trades. A losing trade can score 5 if it followed the plan. A winning trade can score 1 if it was impulsive and poorly managed.
What to Watch
Compare trade quality with P&L over time. If high-quality trades are profitable and low-quality trades are damaging your account, your next improvement is obvious: take fewer low-quality trades.
Bonus Metrics Worth Tracking
Once the main 10 metrics are in place, these extra metrics can add more clarity:
- Average trade duration: Helps identify whether you hold trades according to plan.
- Performance by setup: Shows which strategies deserve more focus.
- Performance by market condition: Reveals where your edge works best.
- Performance by time of day: Helps find your strongest and weakest sessions.
- Emotional state by result: Shows whether fear, boredom, or frustration affects performance.
How These Metrics Work Together
No single metric tells the full story.
For example:
- High win rate with large average losers may still lose money.
- Strong risk-reward with very low win rate may be hard to execute emotionally.
- Positive P&L with low rule adherence may hide bad habits.
- Low drawdown with tiny average winners may not produce enough return.
- Good expectancy may disappear if trading costs are ignored.
The goal is to review metrics together, not worship one number.
Simple Trading Metrics Dashboard
Here is a simple structure you can use in your weekly review:
| Metric | What It Answers |
|---|---|
| Net P&L | Did the account grow or decline? |
| Total R | How did I perform relative to risk? |
| Win rate | How often did trades win? |
| Average winner | Are winners large enough? |
| Average loser | Are losses controlled? |
| Expectancy | Does the system have positive average outcome? |
| Max drawdown | How painful was the worst decline? |
| Rule adherence | Did I actually follow the plan? |
| Trade quality | Were my decisions repeatable? |
| Setup performance | Where is my edge strongest? |
How TradeDoctorAI Helps Track Trading Metrics
TradeDoctorAI helps traders turn raw trade data into clearer performance feedback.
Instead of only seeing a list of trades, you can review metrics with context:
- Which setup produced the best average R?
- Which emotional state appeared before your biggest losses?
- Are your planned risk-reward ratios matching actual results?
- Do your best trades happen during specific market conditions?
- Does your rule adherence drop after losing trades?
This matters because metrics are most useful when they explain behavior. TradeDoctorAI helps connect the numbers with the decisions behind them.
You can explore more trading journal and performance review guides on the TradeDoctorAI blog.
Common Mistakes Traders Make With Metrics
Mistake #1: Tracking Too Many Numbers
More metrics do not automatically mean better review. Start with the numbers that influence decisions: R-multiple, average win/loss, drawdown, rule adherence, and setup performance.
Mistake #2: Ignoring Trading Costs
Spreads, commissions, slippage, funding fees, and platform costs matter. A small edge can disappear after costs.
Mistake #3: Reviewing Too Small a Sample
Five trades do not prove much. Use small samples for clues, but wait for larger samples before making major strategy changes.
Mistake #4: Looking Only at Winning Percentage
Win rate feels good, but it is incomplete without average winner, average loser, and expectancy.
Mistake #5: Not Tracking Rule Breaks
If you do not track rule adherence, you may blame the strategy when the real issue is execution.
Featured Answer: What Trading Performance Metrics Should Traders Track?
Traders should track net profit or loss, R-multiple, win rate, average winner, average loser, risk-reward ratio, expectancy, maximum drawdown, rule adherence rate, and trade quality score.
These metrics help traders understand not only whether they made money, but whether their strategy, risk management, and decision-making are improving.
FAQ
What is the most important trading performance metric?
There is no single most important metric. Expectancy, R-multiple, drawdown, average win/loss, and rule adherence are especially useful because they show both performance and process quality.
Is win rate enough to measure trading success?
No. Win rate only shows how often you win. It does not show whether your winners are large enough, whether your losses are controlled, or whether your strategy has positive expectancy.
Why should traders track R-multiple?
R-multiple helps traders measure results relative to planned risk. It makes trades easier to compare across different position sizes, markets, and account balances.
How often should I review trading metrics?
Review basic metrics after each session and do a deeper review weekly. Monthly reviews are useful for setup performance, drawdown, and longer-term strategy decisions.
Can TradeDoctorAI track trading performance metrics?
TradeDoctorAI helps traders journal trades, review risk, analyze execution, identify patterns, and understand performance metrics in context. It helps connect numbers with trading behavior.
Final Thoughts: Track the Numbers That Change Decisions
Trading metrics are not there to make you feel good or bad. They are there to make your feedback clearer.
If you track the right numbers, you can stop guessing. You can see whether your winners are big enough, whether your losses are controlled, whether your rules are being followed, and whether your edge is showing up in real trades.
TradeDoctorAI helps traders review performance with structure. Use it to track your metrics, analyze your decisions, and identify the patterns behind your best and worst trades.
The goal is not to become obsessed with numbers. The goal is to use the right numbers to make better trading decisions.