
The short version: the Sharpe ratio is your average return divided by how much that return bounces around. A higher number means you earned more per unit of wobble. For a day trader it is a useful sanity check and a poor scoreboard, and the reason is mostly about sample size, which we will get to with real arithmetic.
The formula, with ten days of numbers
Sharpe = (average return − risk-free rate) ÷ standard deviation of returns. Day traders usually set the risk-free rate to zero, because the capital is only deployed for hours at a time. So it collapses to average daily return divided by the standard deviation of daily returns.
Here are ten made-up trading days, each as a percentage of account balance:
| Day | 1 | 2 | 3 | 4 | 5 | 6 | 7 | 8 | 9 | 10 |
|---|---|---|---|---|---|---|---|---|---|---|
| Return % | +0.8 | −0.4 | +1.2 | −0.9 | +0.3 | +0.6 | −0.5 | +1.0 | −0.2 | +0.5 |
The average is 0.24% a day. The sample standard deviation works out to about 0.70%. Divide one by the other and you get a daily Sharpe of roughly 0.34.
Most platforms annualize it by multiplying by the square root of 252 trading days (about 15.9), which gives 5.4. A Sharpe of 5.4 would put you ahead of nearly every professional fund on earth. You are not that good after ten days. Nobody is. That gap between the number and reality is the whole lesson.
Why ten days (or thirty) tells you almost nothing
The uncertainty around a Sharpe estimate is large. A rough rule: the standard error of the annualized figure is about the square root of (1 + 0.5 × Sharpe² per period) divided by the number of years of data. You do not need to memorize that. Just notice what it says: with a few weeks of trades, a measured Sharpe of 2 could easily belong to a strategy whose true Sharpe is 0, or one whose true Sharpe is 4.
Practical thresholds we would use:
- Under 60 trading days: ignore the Sharpe, look at the raw equity curve and your rule adherence.
- 60 to 250 days: treat it as a rough range, not a point estimate.
- A full year or more under the same strategy: now it starts to mean something.
Where Sharpe misleads day traders specifically
It punishes upside volatility. A week where you make 4% on a news move counts as "more volatile" and drags the ratio down, even though nobody has ever complained about a surprise gain. The Sortino ratio fixes this by only counting downside deviation, and it is the better habit if your returns are skewed.
It hides fat tails. Selling small, frequent wins and occasionally taking one huge loss produces a lovely Sharpe right up until the loss arrives. If your strategy is short volatility in any form, a high Sharpe should make you more nervous, not less.
It depends on how you slice time. Daily, weekly and per-trade returns give different answers for the same account. Pick one convention and stay with it, or you will fool yourself comparing last month to this one.
What to look at first instead
For a trader with under a year of history, these three tell you more than Sharpe does:
- Expectancy in R: how much you make per trade, after losses, in units of what you risked.
- Profit factor: gross profit divided by gross loss.
- Maximum drawdown and how long it took to recover.
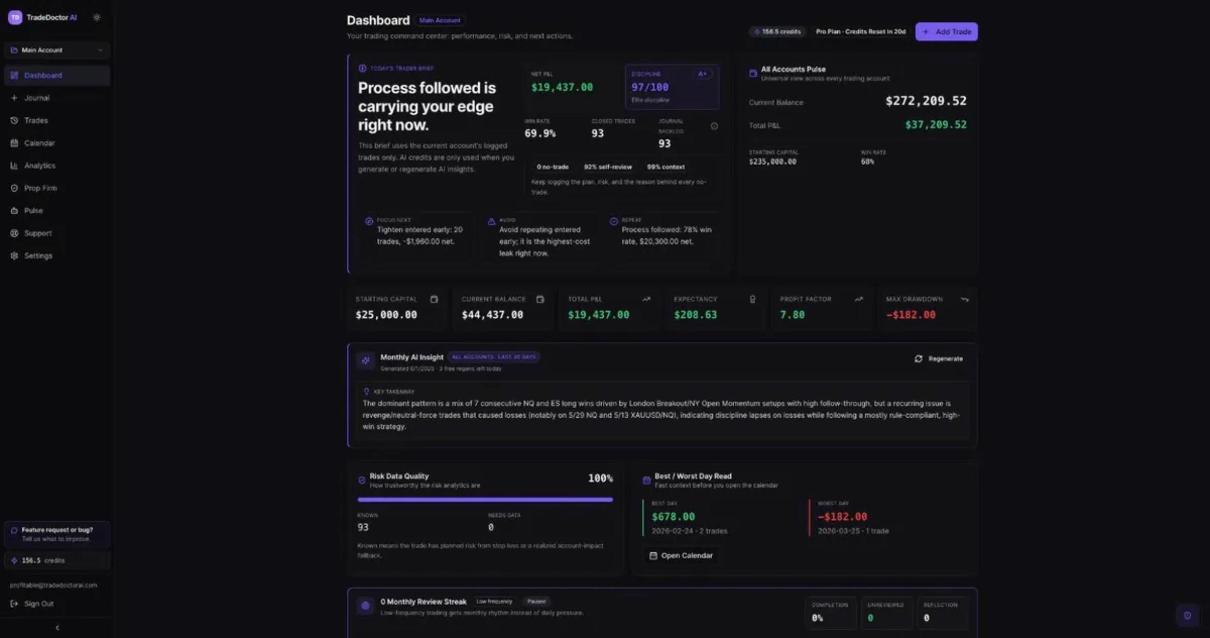
TradeDoctor AI reports all three from your imported or logged trades. It does not currently calculate a Sharpe ratio, and we would rather say that plainly than bolt on a number that looks impressive on 40 trades. If you want one anyway, export your daily P&L, drop it in a spreadsheet and use =AVERAGE(range)/STDEV.S(range)*SQRT(252).
A fair way to use it
Treat Sharpe as a comparison tool between your own months, using identical conventions, once you have at least a few hundred trades. If this quarter’s Sharpe is far below last quarter’s, something changed: position size, instrument, session, or your discipline. That is a prompt to open the journal and look, which is more valuable than any single value of the ratio.
Annualizing: where the big numbers come from
Most published Sharpe figures are annualized, which means the per-period number is multiplied by the square root of the number of periods in a year. For daily returns that factor is about 15.9 (the square root of 252). Take a trader whose daily Sharpe over thirty days is 0.12. Annualized, that becomes roughly 1.9, which sounds respectable. But the 0.12 itself came from thirty observations, and the standard error on a Sharpe estimate from thirty days is large enough that the true value could sit anywhere from negative to above 3. Multiplying by 15.9 multiplies the noise by 15.9 as well.
The practical rule: never compare your annualized figure from a short sample with a fund factsheet. They use years of data and usually monthly returns, so the numbers are not like for like.
Three things that quietly inflate Sharpe
Skipping the losing days you did not log. If your journal only contains trades you remembered to write down, the returns series is missing exactly the days that would pull the standard deviation and the mean in the wrong direction. A complete log matters more than a clever formula.
Selling tail risk. Strategies that win small amounts often and lose big rarely, such as holding a loser without a stop, can show a very smooth equity curve and a high Sharpe right up until the day they do not. Standard deviation does not see a loss that has not happened yet.
Mixing position sizes. If you double your size after a win, your daily returns become more volatile and more autocorrelated. Sharpe treats that as noise rather than as a behavior problem, so it can look fine while your process is deteriorating.
What your journal can show without Sharpe
Everything Sharpe tries to summarize can be seen more directly. The dashboard in a journal shows the equity curve, win rate, average win against average loss, and drawdown. If the curve is smooth, those numbers will already tell you so; if it is jagged, a single ratio will not explain why.
TradeDoctor AI does not calculate a Sharpe ratio. What it shows on the dashboard and analytics pages are the inputs you can check yourself: results over time, win rate, the R-multiple of each trade, and where in your process the losses cluster. If you want a Sharpe figure, export your daily results and calculate it in a spreadsheet using the steps above.
Reading these numbers together is usually more informative. Our guides on trading expectancy and the performance metrics worth tracking cover the alternatives in detail.
A short checklist before you quote a Sharpe ratio
- Do you have at least 60 trading days, and ideally more than 100?
- Are all trades and all days included, including flat days if you are using daily returns?
- Is the risk-free rate set to something realistic for the period, or at least stated?
- Have you checked the largest single loss relative to the standard deviation? If one day is more than three standard deviations, the ratio understates your risk.
- Do you also know your expectancy and your maximum drawdown? If not, start there.
If the answer to most of these is no, the number will mislead you more than it helps, and your time is better spent on the review habits that actually change results.
Frequently Asked Questions
What is a good Sharpe ratio for a day trader?
Above 1 annualized is respectable, 2 is strong, and anything above 3 sustained over a year deserves suspicion about the data or the costs included. Short samples routinely produce numbers far higher than these by chance alone.
Should I use per-trade or daily returns?
Daily is the common convention because it matches how accounts are marked to market and how benchmarks are quoted. Per-trade Sharpe is not comparable with published figures.
Do commissions and spreads belong in the calculation?
Yes. Use net returns after every cost. A strategy that scalps small moves can show a beautiful gross Sharpe that disappears once costs are included.
Is Sharpe or profit factor better?
They answer different questions. Profit factor tells you how much you win per dollar lost. Sharpe tells you how smooth the ride was. Beginners get more from profit factor and expectancy because they are easier to interpret on small samples.
If you are building the habit of reviewing your numbers, our guide on which trading metrics are worth tracking is a good next read.